
A well-designed infographic of your original research is an excellent way to share your research with the community and increase engagement.
If you think infographic’s moment in the sun has passed… Research shows that you might be wrong! According to a study we did earlier this year, over 1/3 of marketers consider infographics to be a most trusted type of content for their target audiences. (Second only to research of course).
A well designed infographic makes it easy for your audience to digest the data you’d like to show them. They are a perfect way to display research that can otherwise look a bit, well, boring.
You know what most infographics need? RESEARCH! Tell a story with your infographic using research findings from one report on a specific topic, or incorporate data from a number of different reports that all speak to the same point you’re trying to make.
Start with a problem or challenge, and provide key metrics to back up what that means for your audience. Sharing your research with an infographic is a compelling way to provide your audience with useful information.
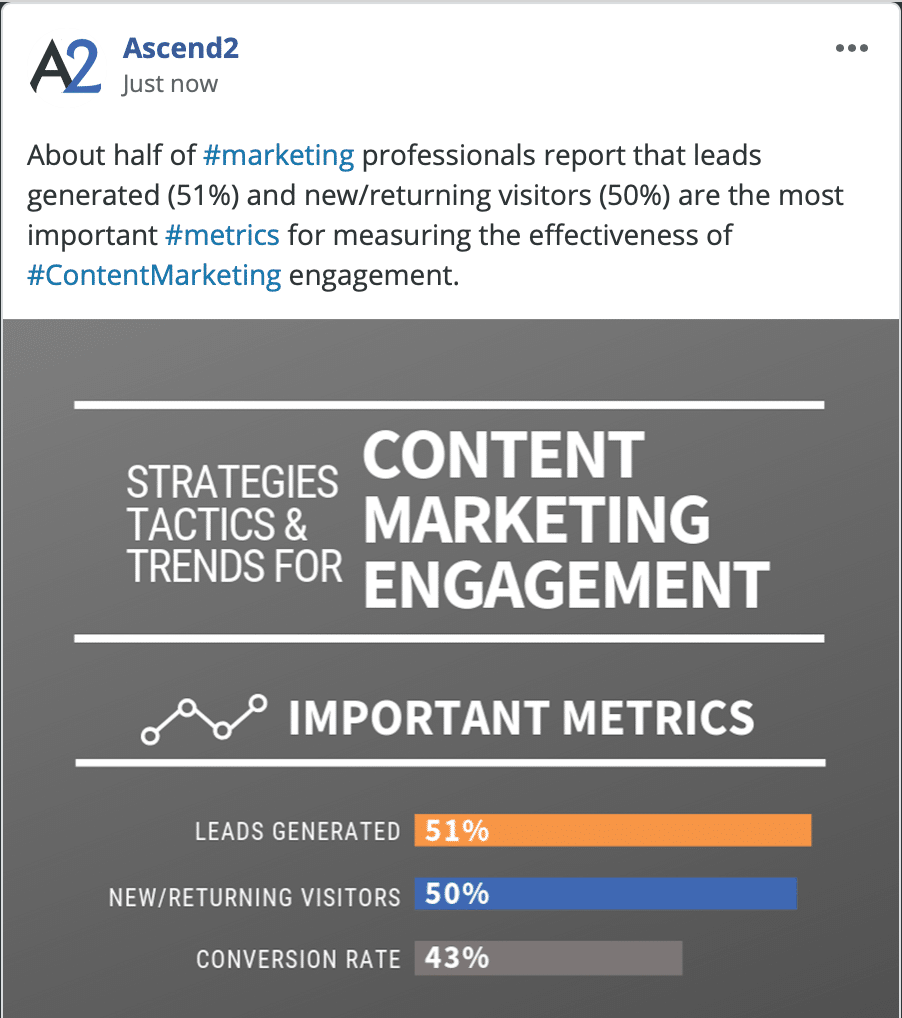
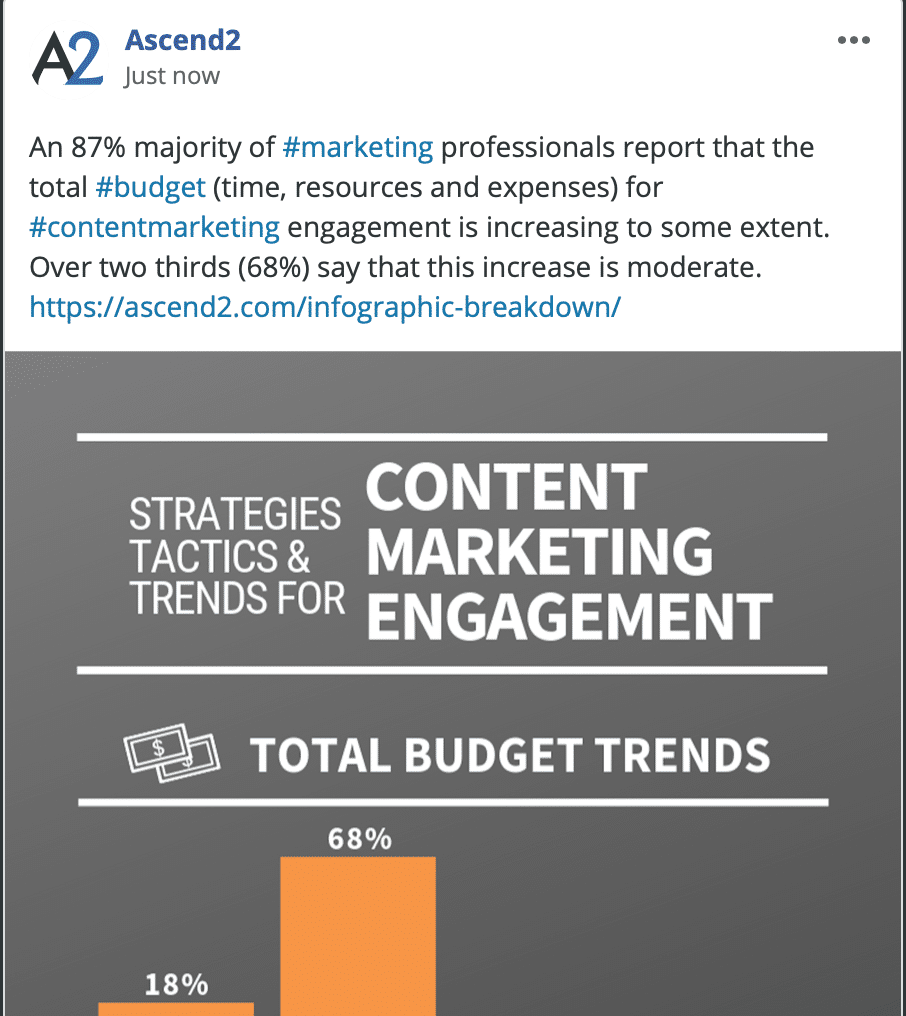
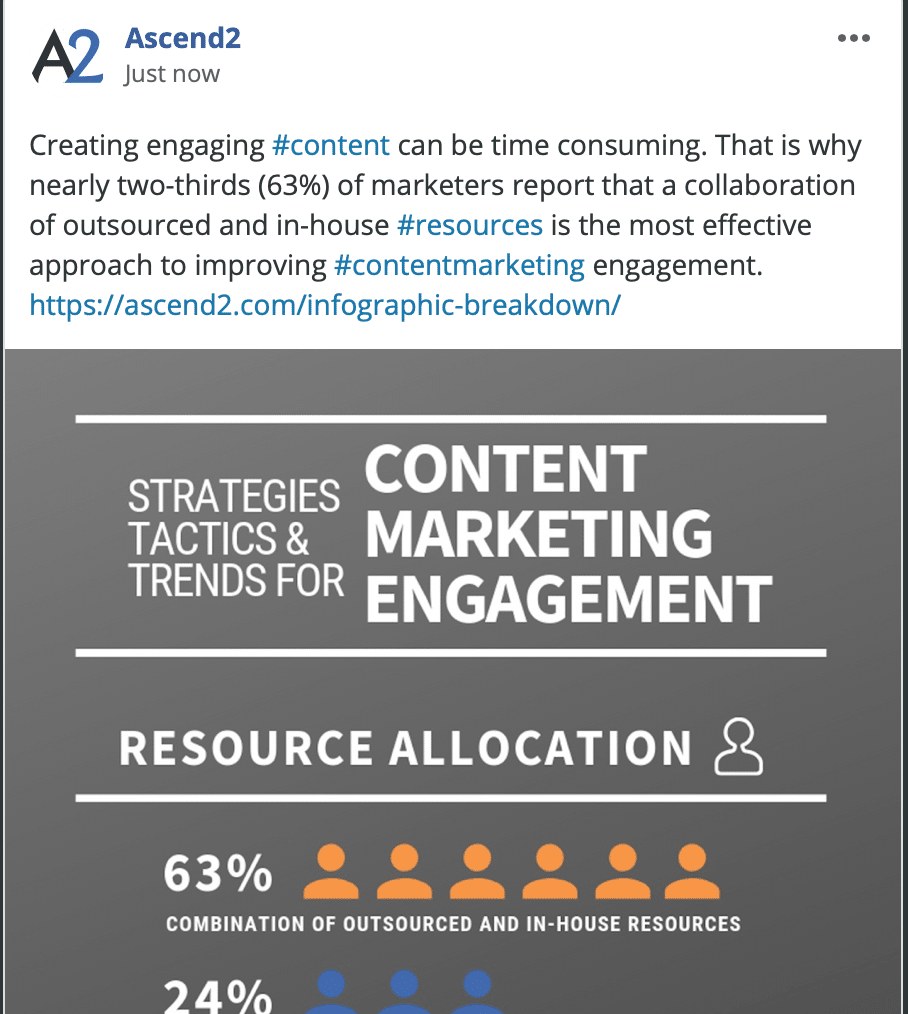
Here’s an idea… break up your infographic into a bunch of social media posts that just display one statistic or metric each. Honestly guys, the you can get so much mileage out of one of these.
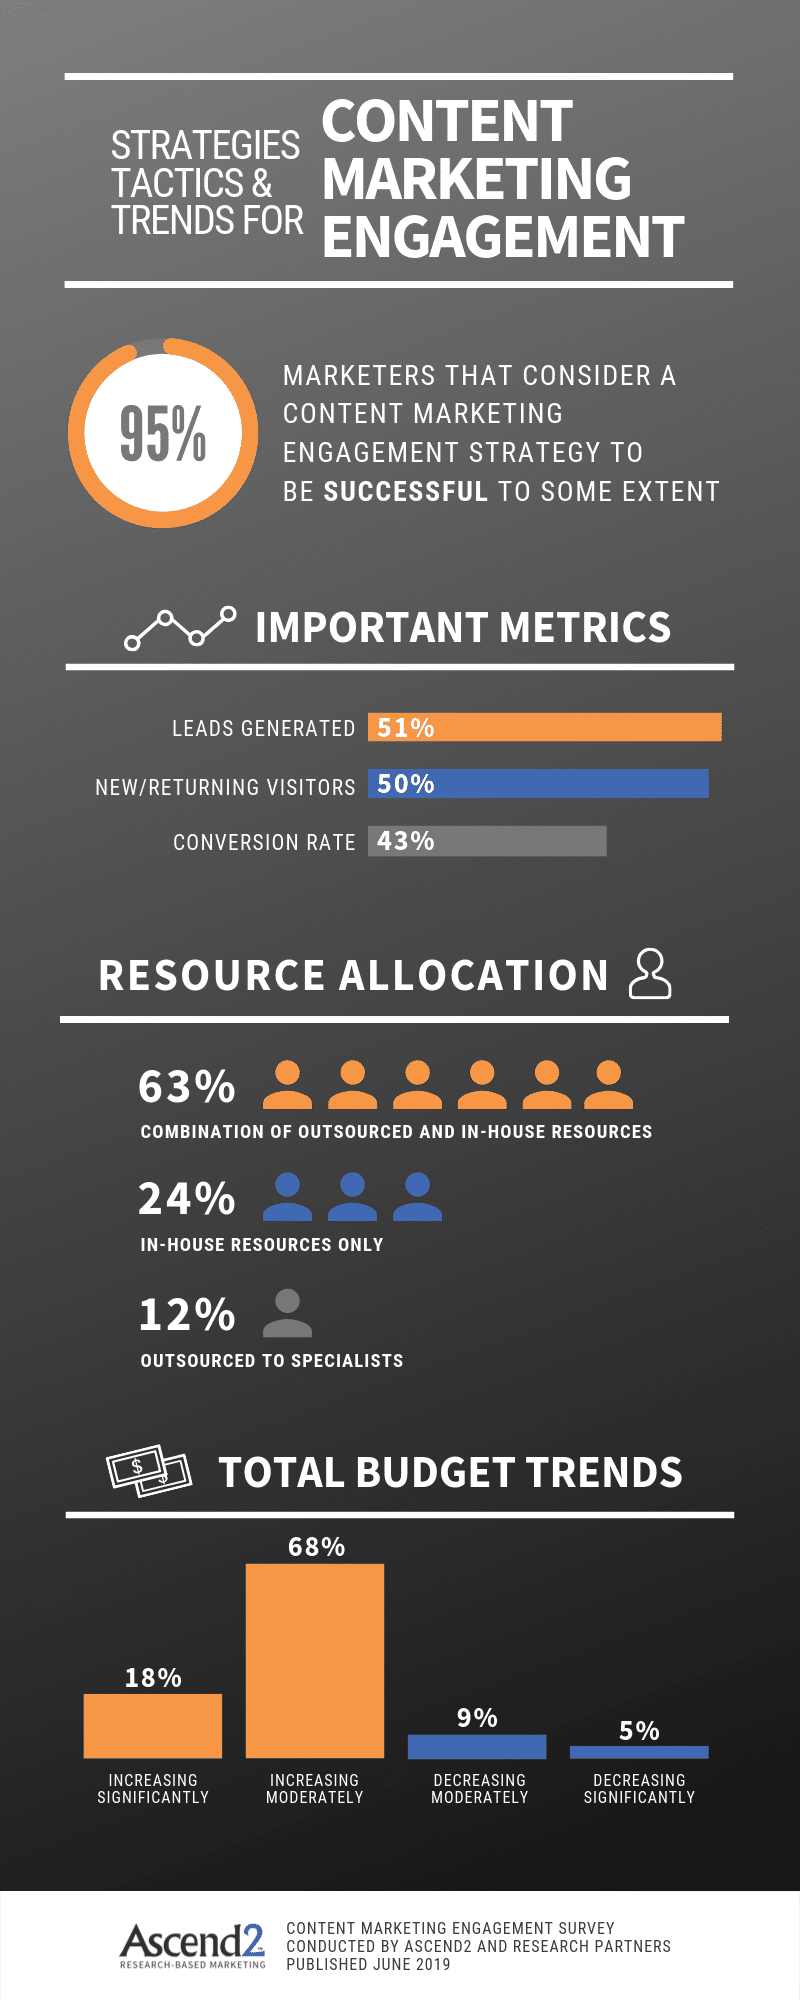
Scroll down to see an example: I created this really simple infographic for our recent “Content Marketing Engagement” research report and then broke it up into a number of social posts.
So this Content Marketing Engagement infographic…
…Turns into:
We can’t wait to see what you create using our research!