
Tedious dives into data. An infinite cycle of refinement. Input from multiple stakeholders all with varying objectives. Customer Journey Mapping sounds like a blast doesn’t it!?
Well, creating a relevant and enjoyable customer experience requires a deep understanding of what your customers need, and how they interact with your product or service. By visualizing this with journey maps, brands are understanding their customer better. This process serves as a mechanism for adapting to customer needs, refining targeted audiences, building authority, increasing retention, and growing customer bases.
“We know the ins and outs of our products and services. We’ve labored over our sites. But our customers don’t have that context. What’s clear to us may be confusing for them. A map brings those sticking points into focus.” – Elise Morres, Kantaloupe | LinkedIn
According to recent research, nearly half (48%) of marketers report that allocating enough time, staff, and resources to successfully execute a customer journey mapping strategy is a major challenge. We know you’re strapped for time. So with the help of some experts, and the 277 marketing professionals who participated in our Customer Journey Mapping survey, we put together a list of four truths you simply can’t ignore when implementing a journey-mapping strategy.
Let Go of Preconceived Notions
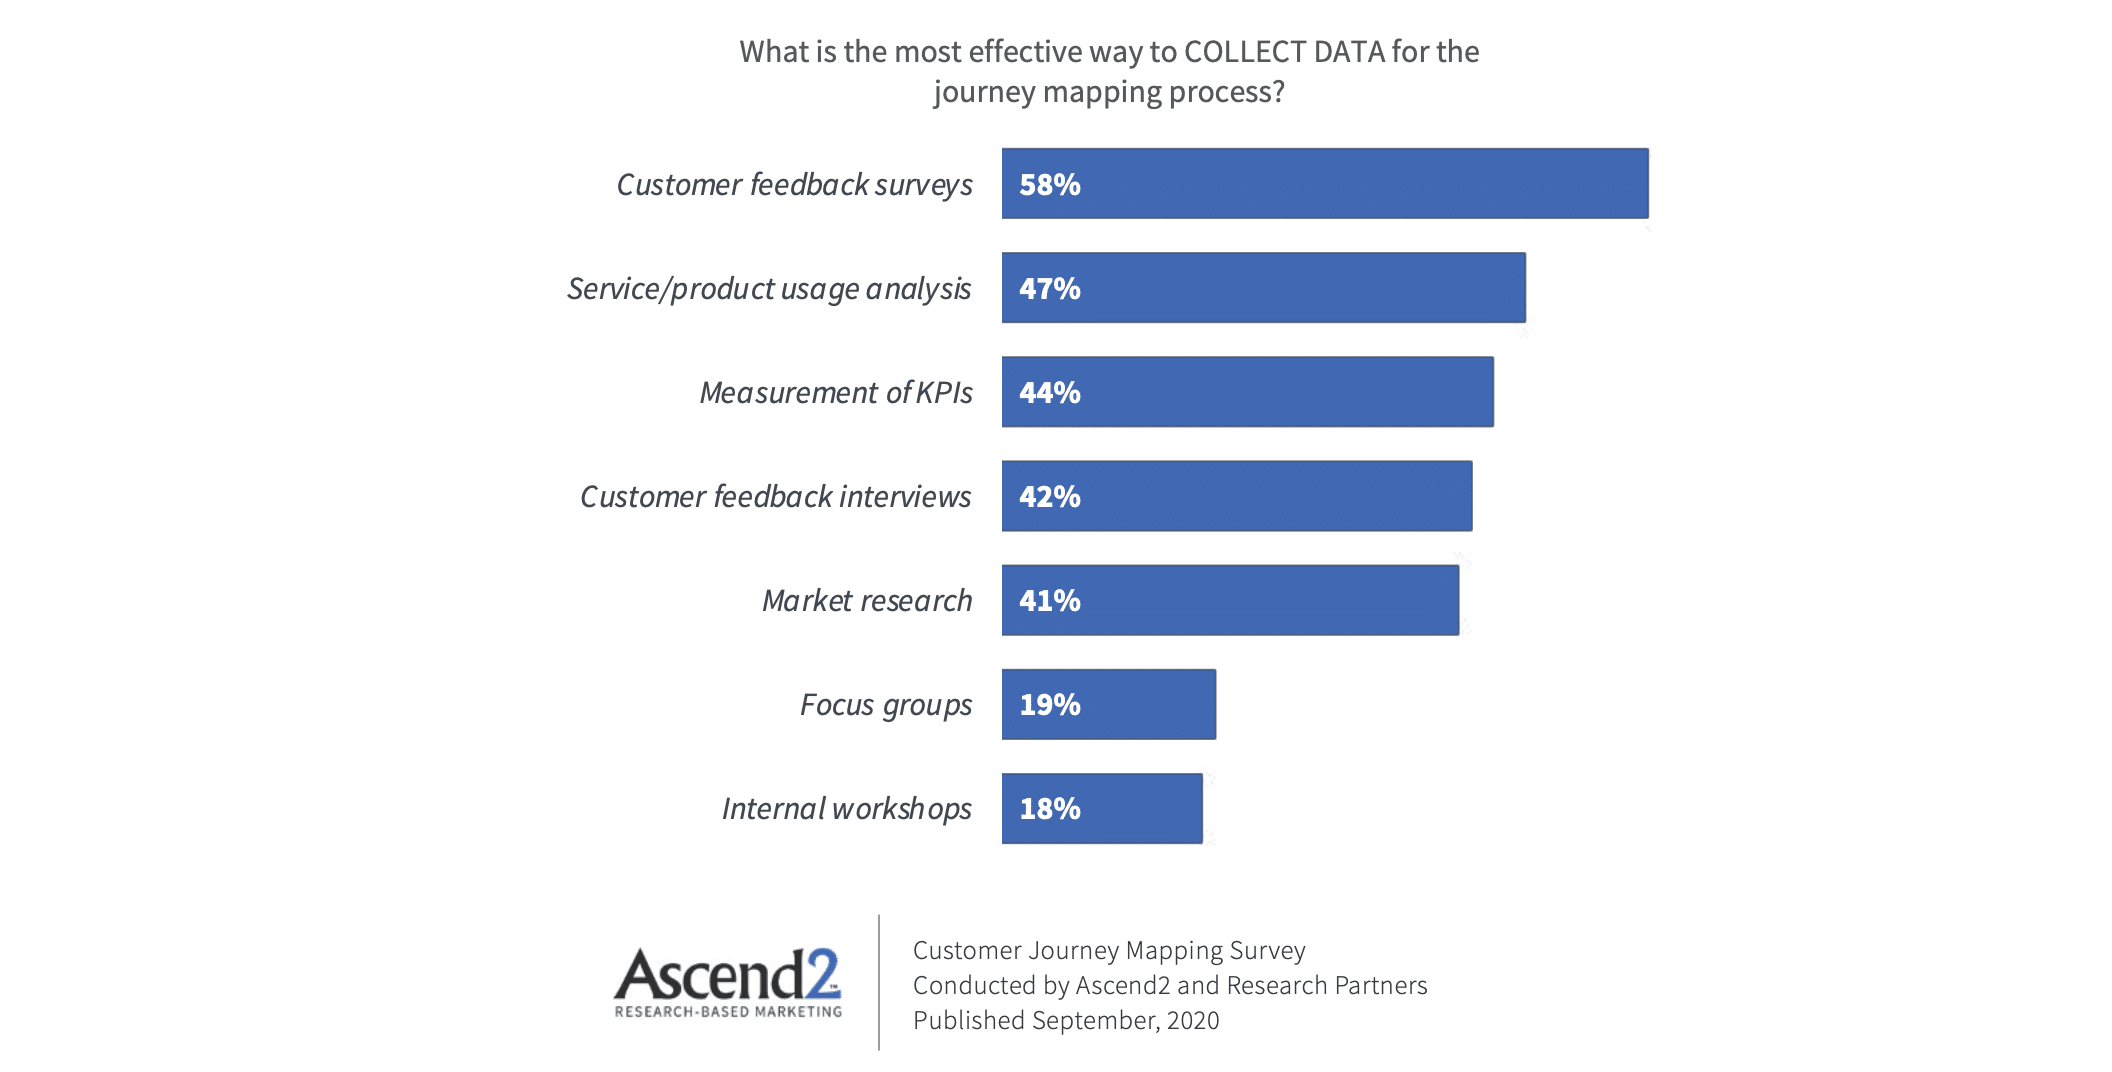
Without quality data, a customer journey map would be based on perception. These subjective assumptions are often not the reality of how someone interacts with a brand. Marketers note that customer feedback surveys (58%), usage analysis (47%) and KPIs (44%) are the most effective sources of data used for journey mapping.
“Trying to get all staff to act and see things from a customer perspective can be difficult as you have to change people’s mindset and what they perceive as best practice.” – Brett Downs, HARO Helpers | LinkedIn | Twitter
You simply can’t ignore the data collected from your customer’s actions and feedback. Take time to analyze how your product or service is used. Measure KPIs, but try examining them from a new perspective. Get ready to let go of what you thought to be true about your customer and approach all feedback with a willingness to be agile.
“The biggest roadblocks to effective journey mapping come about when client preconceptions of their target customers clash with the actual data collected and customer research. It’s not uncommon to have clients that are firmly entrenched in an ethos that isn’t reflected in their customer base, and these clients are often unwilling to accept and adapt to that conflicting data.” – Jakob Paumgartner, LinkedIn
The More Cross-Department Involvement, the Better
We know, we know. This sounds like a nightmare. But involving stakeholders throughout various departments will not only keep everyone on the same page, it will cover ALL of your bases, ensure a seamless experience for your customers and combat issues of buy-in across your organization.
“You might have a fantastic customer support staff, willing to answer questions, but if the website or sales staff offers inaccurate or contradictory facts, the consumer experience would be that of frustration, not of great service.” – Eliza Nimmich, Tutor the People | LinkedIn
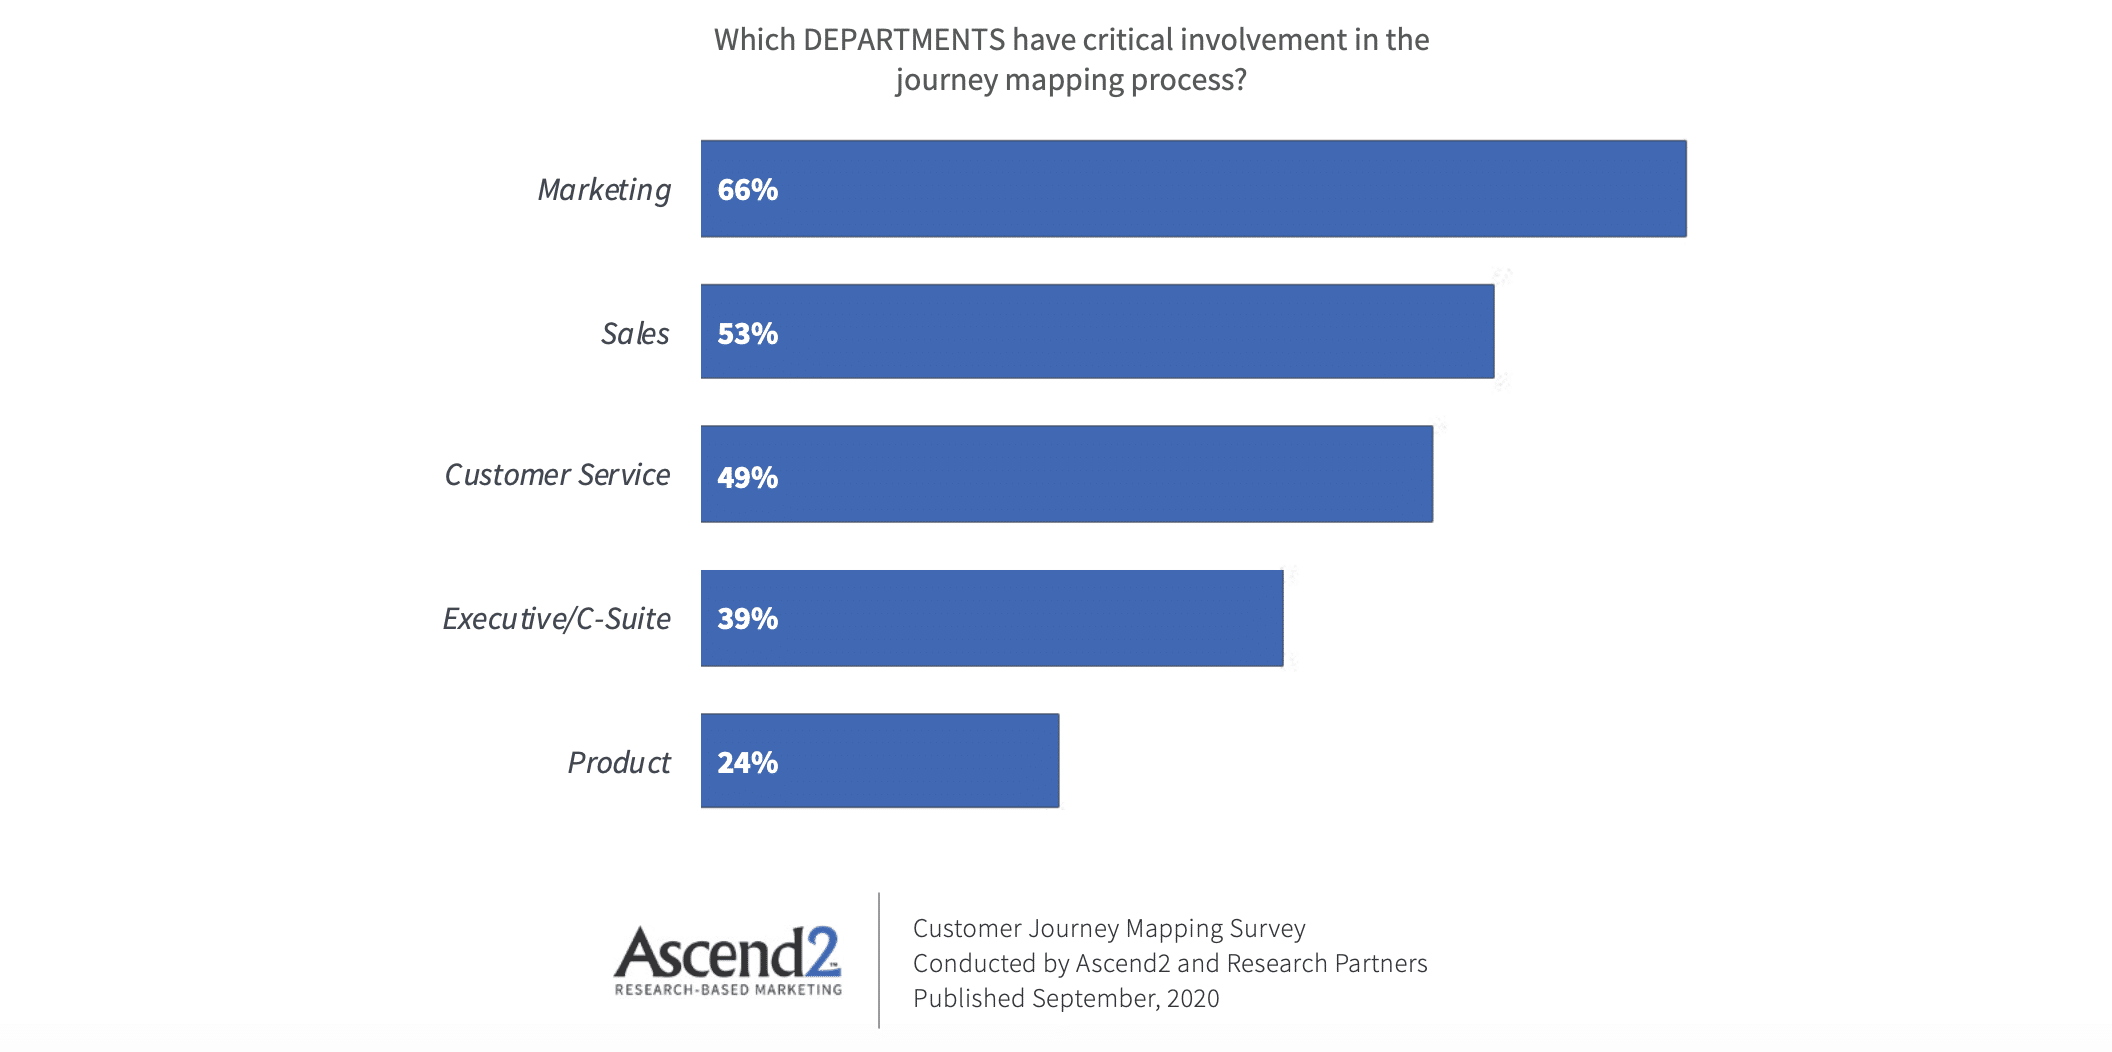
Every organization is different, and sometimes involving this many key players might be next to impossible. If that is the case, start with a core group from the marketing, sales, and customer service departments. According to those surveyed, these three departments have the most critical involvement in the journey mapping process.
Small Changes Can Make a Big Impact
With a lack of time and resources in mind, the key is to start small. You don’t have to start out with a journey map for every single product, service, or persona. Instead, choose a clearly defined segment that you’d like to target and define an objective for them. Then back into your mapping process using these elements. For example, target stale email subscribers and create a journey of re-engagement for them.
“For us, something that has been really key to doing this is using friction logs to put ourselves in the users’ shoes. Start off with one task you want to do, that might be creating an account, then write down every key moment along the way. Color coding comes in handy here as you can step back from the task you’ve completed and instantly see how easy, or difficult it was. The process should be conversational and read like a diary entry—only then will you truly understand how users interact with your product.” – Kirsty Finlayson, Chameleon | LinkedIn
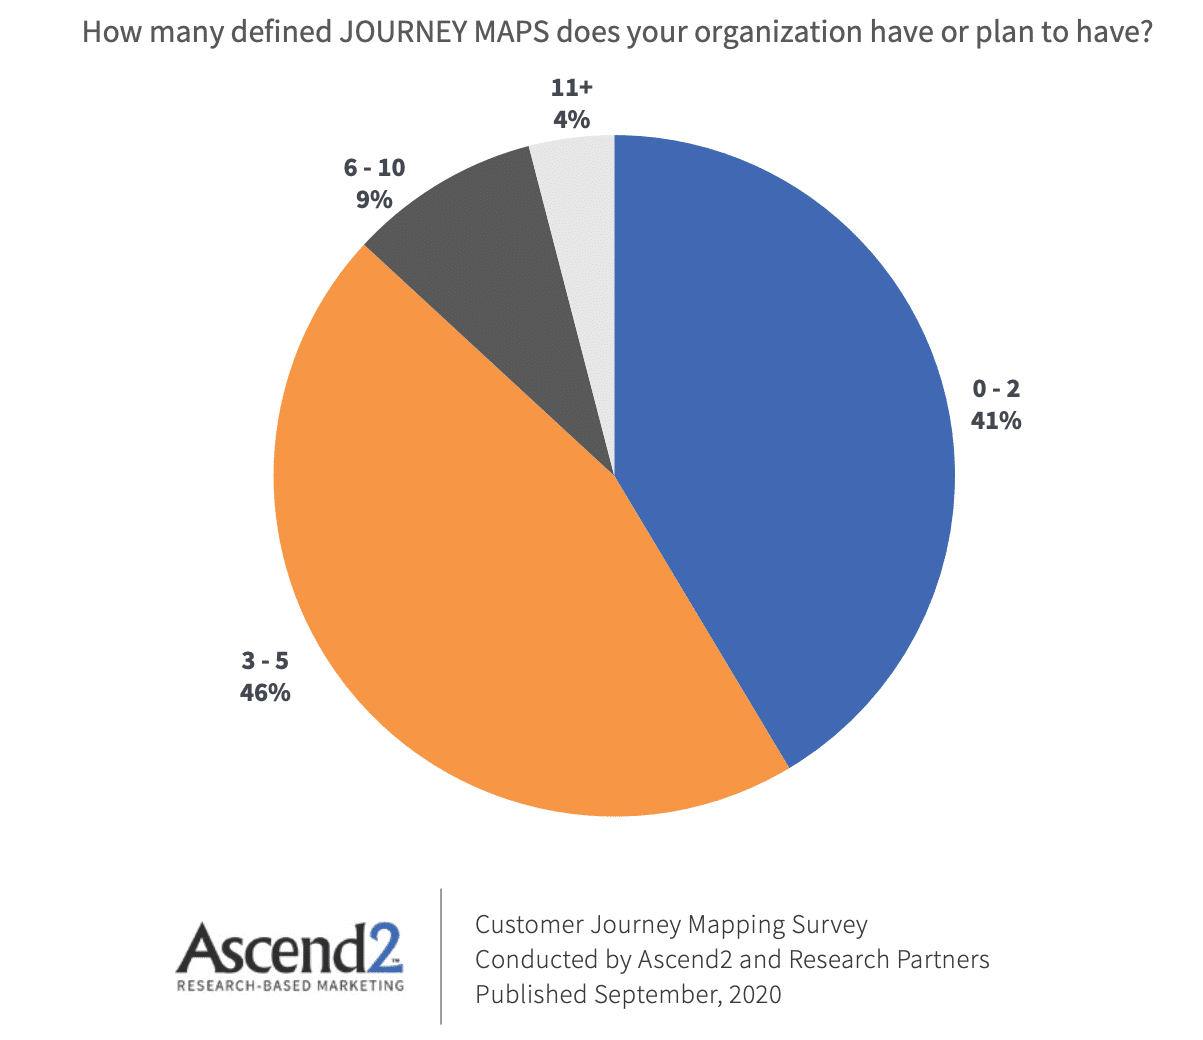
The vast majority of marketers have 5 or fewer journey maps. Start small, and work your way to developing more maps according to outcomes you’d like to achieve.
Don’t Lose Sight of the Potential Payoff
Though the journey-mapping process can be grueling, the potential payoffs can be substantial. According to research, 87% of marketers are seeing success from implementing a strategy. With your primary objectives in mind, continue to re-examine data to optimize each touchpoint. The more you learn about your customers, the better your ability to deliver exactly what they need, exactly when they need it.
“Initially, we struggled a little because of all the complexity of mapping the journey. But then, we invested time and effort to find out where to start and then determine all the touchpoints. And we soon learned that people visiting our ‘testimonial’ and ‘research process’ pages tended to convert at a higher rate than the rest. So, we made related changes in the website design and located them in a prominent place. We also noticed that our newsletter’s readership had little correlation with the repeat visitors, so we changed our email content accordingly. Now, we undoubtedly are enjoying the fruits of our labor with the enhanced customer experience!” – Nathan Sebastian, GoodFirms | LinkedIn | Twitter
About the research
Ascend2 surveyed 277 marketing professionals during the week of August 10, 2020.
Primary Marketing/Sales Channel
- B2B: 42%
- B2C: 29%
- B2B & B2C equally: 29%
Number of Employees
- More than 500: 23%
- 50 to 500: 22%
- Fewer than 50: 55%
If you have any questions about a specific segment of this survey, please contact us here.